Your home over time
Understand what is really happening.
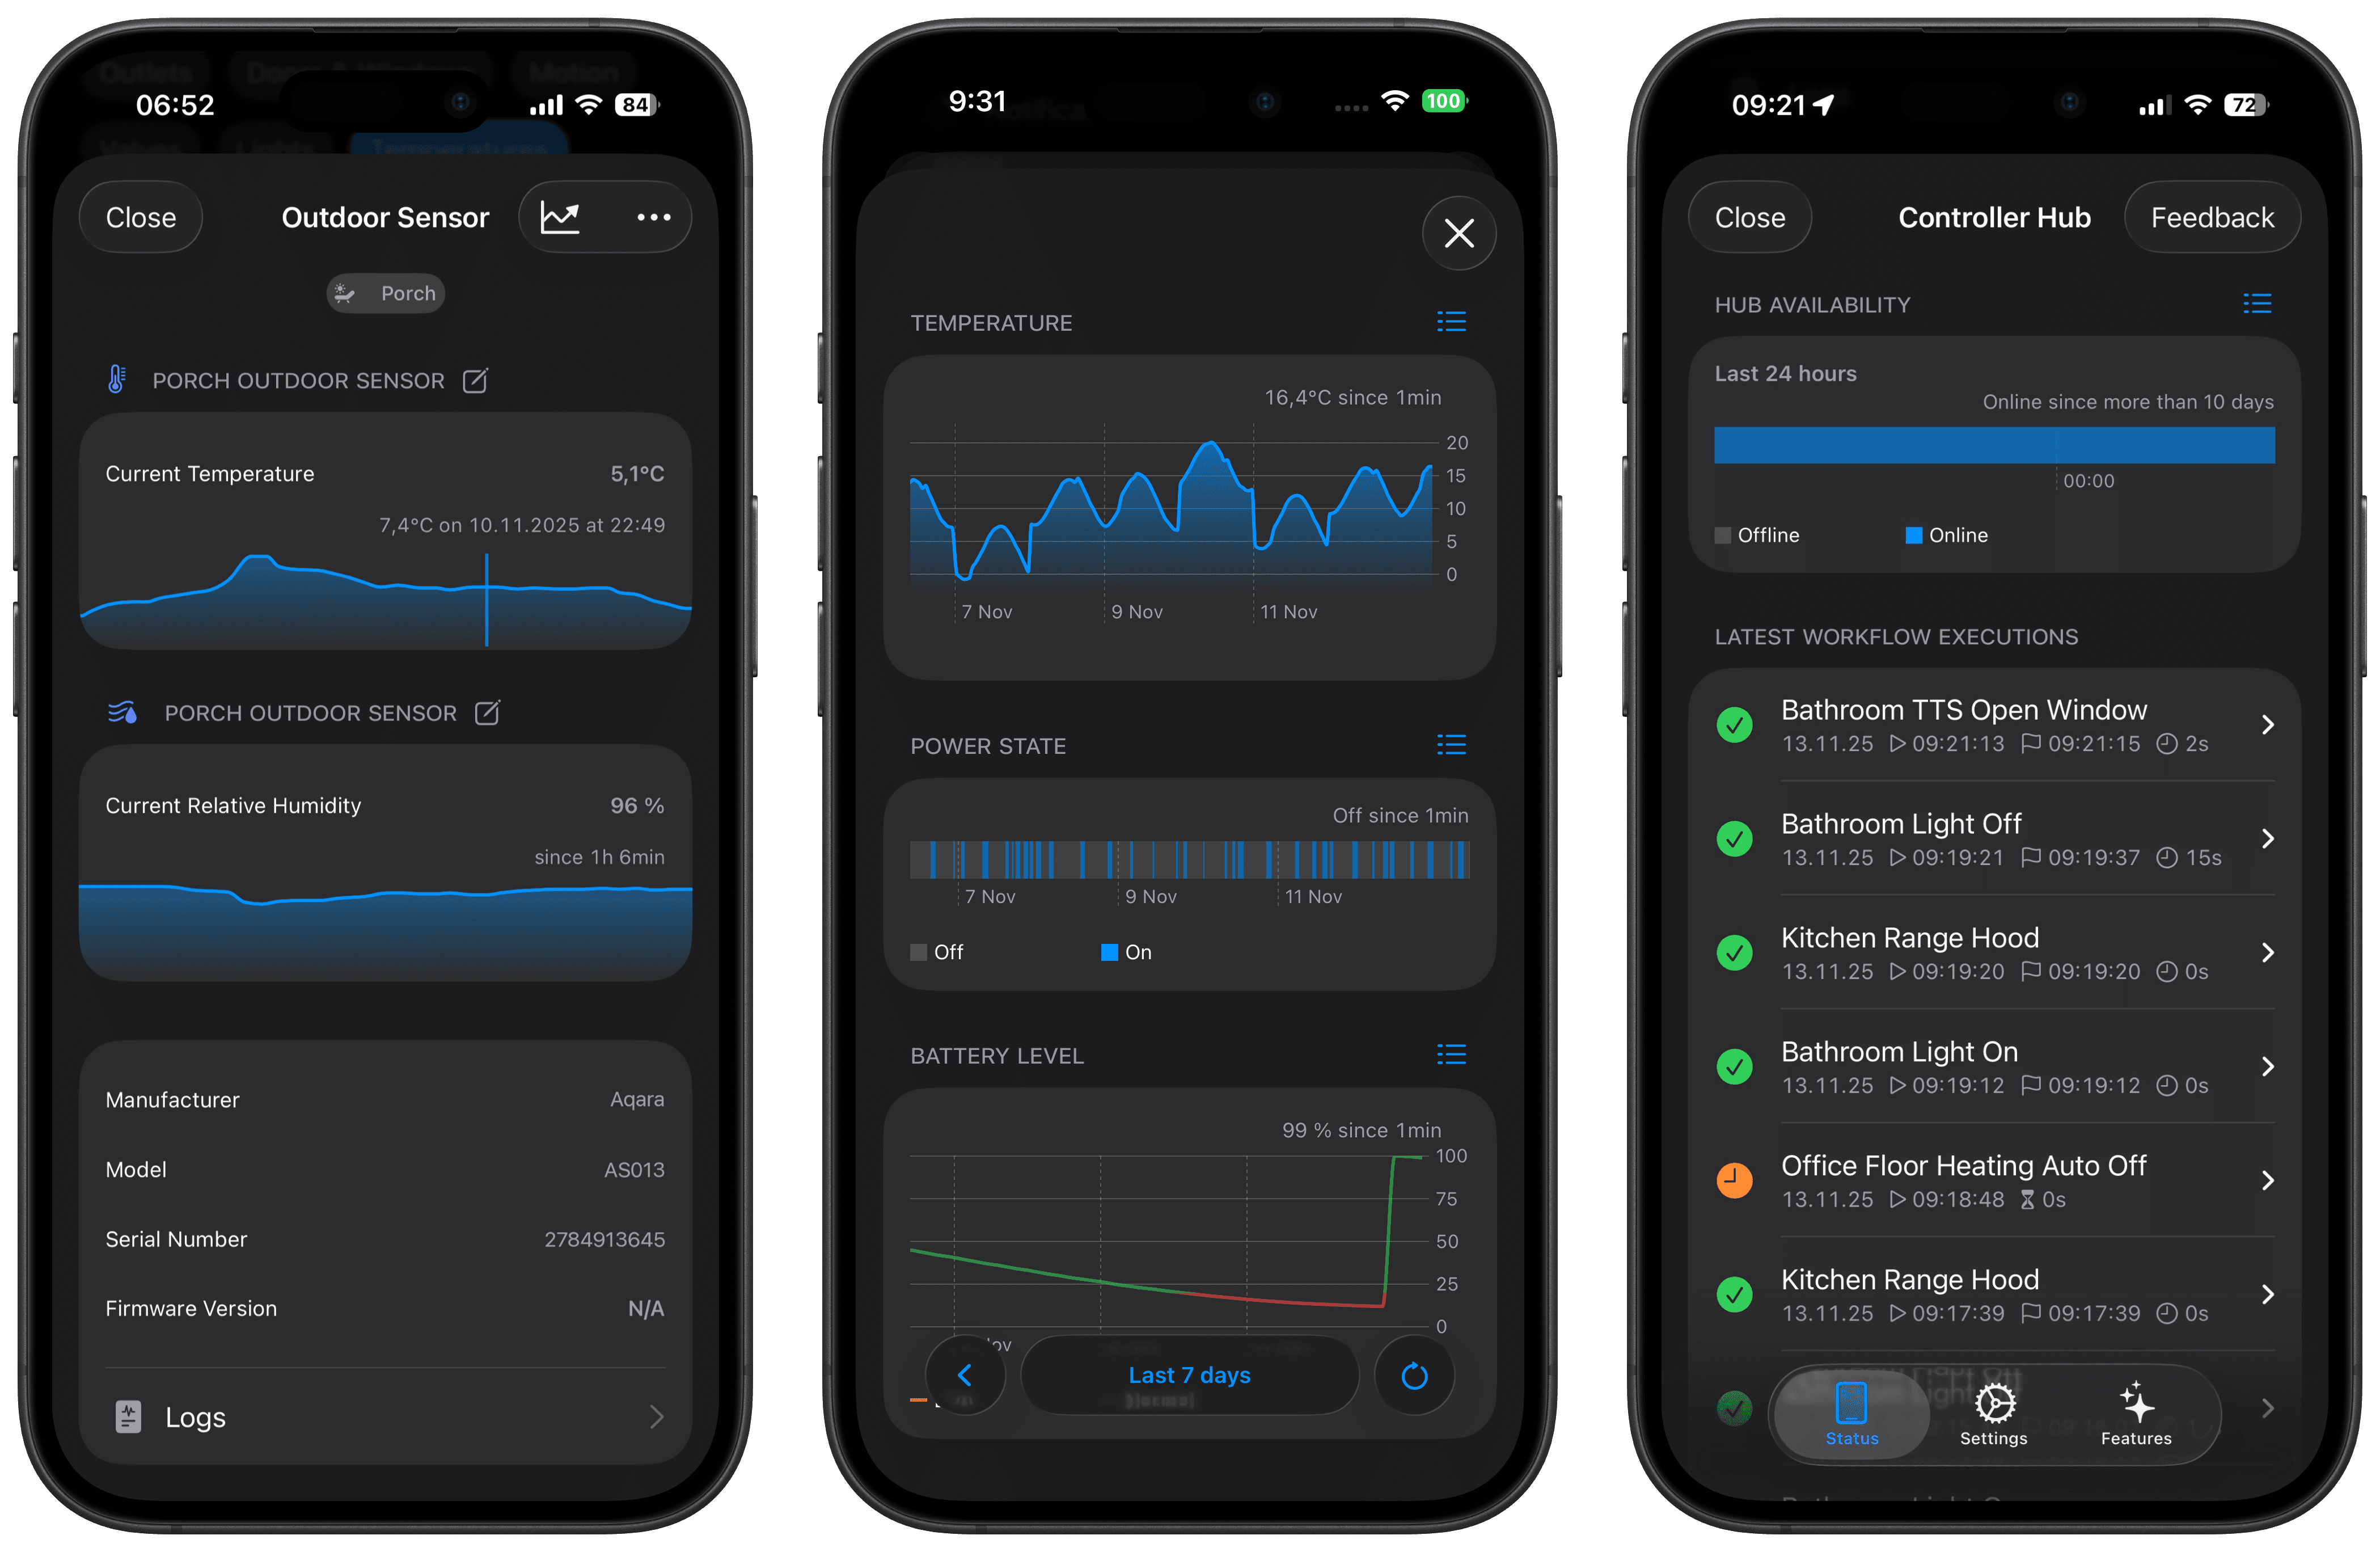
Spot patterns, grasp connections, and see at a glance what happened when - and why.
Live History
Spot patterns. Make better decisions.
Your home over time
Spot patterns, grasp connections, and see at a glance what happened when - and why.
Scrub smoothly through past values to pinpoint the exact moment that matters. And when you need full detail, switch to raw data view anytime.
Temperature
15.4°C
Supported History Types
Track the signals that matter most in your Apple Home setup in one place. Instead of isolated snapshots, you see patterns over time and quickly spot what is worth optimizing.
And many more history types.
Charts help you spot practical improvements you can apply to your Apple Home setup.

If temperature and humidity rise every night, adjust ventilation timing or shading earlier in the evening.

When specific sensors drain faster than expected, you can schedule replacements before reliability drops.

Recurring motion patterns reveal where sensors react too late or too early, so you can tune placement and logic.
Controller Hub
Controller Hub records history data continuously. Without a Controller Hub, there is no continuous history for Charts.
Set up Controller HubDedicated device
Use a dedicated iPhone, iPad, Apple TV, or Mac as your Controller Hub device.
Always in foreground
Keep Controller open on that device so chart collection runs without gaps.
Uninterrupted history
This is what makes trends trustworthy and long-term analysis reliable.